Static Testing
Definitions
We would like to introduce some concepts used in static code analysis and code review.
Static testing examines work products without executing the software under test. Requirements, designs, source code, test cases, user documentation, and other work products can be reviewed or analysed to find defects. Its main goal is to improve quality by detecting problems early in the development lifecycle. Static and dynamic testing reveal different kinds of defects and should normally complement each other.
An error is a human action that produces an incorrect result, such as misunderstanding a requirement or implementing an incorrect condition.
A defect is an imperfection in a software work product that may cause the software to fail or to behave incorrectly. A defect may occur in requirements, design, source code, tests, or documentation.
A failure is an observable deviation of the running software from its expected behaviour. A defect may cause a failure when the affected code is executed under appropriate conditions.
A bug is a defect in software that can cause the program to produce an incorrect result, behave unexpectedly, or fail under particular conditions. Examples include incorrect conditions, off-by-one errors, null-pointer dereferences, and improper resource handling.
A warning is a diagnostic message indicating a potential problem that does not necessarily prevent the program from being compiled or executed.
A code smell is a characteristic of source code that may indicate a deeper problem in its design or maintainability, although it is not necessarily a defect. Examples include duplicated code, overly long methods, excessive nesting, large classes, and long parameter lists.
A vulnerability is a weakness that can be exploited to compromise the confidentiality, integrity, or availability of a system. Examples include SQL injection, buffer overflow, insecure deserialization, weak authentication, and improper input validation.
A coding rule violation occurs when source code does not comply with an established coding standard or project-specific rule. Examples include violations of Python’s PEP 8 style guide, incorrect naming conventions, prohibited language constructs, or missing documentation
A false positive is a reported issue that is not an actual problem in the analysed context.
A false negative occurs when an analysis tool fails to report a problem that is actually present.
Unreachable code is code for which no possible execution path exists from the program entry point.
Unreachable code vs dead code
Unreachable code is a form of dead code, but dead code can also be executed while producing a result that is never used.
Duplicate code consists of identical or substantially similar code fragments appearing in multiple locations. It increases maintenance effort and the risk of inconsistent changes.
A code clone is a source-code fragment that is identical or similar to another fragment in structure, syntax, or behaviour.
Common categories include:
- Type-1 clone: identical code except for formatting or comments;
- Type-2 clone: structurally identical code with renamed identifiers or changed literals;
- Type-3 clone: similar code containing added, removed, or modified statements;
- Type-4 clone: code implementing equivalent behaviour using different syntax or structure.
Cyclomatic complexity is a control-flow metric that measures the number of linearly independent execution paths through a program component.
For a control-flow graph, it can be calculated as:
where \(E\) is the number of edges, \(N\) is the number of nodes, and \(P\) is the number of connected components.
Technical debt is the additional future cost caused by design or implementation decisions that make software harder to understand, test, maintain, or extend.
A design pattern is a reusable, general solution to a recurring software-design problem in a particular context. It describes the structure and collaboration of components rather than providing a complete implementation. Examples include Factory Method, Observer, Strategy, Adapter, and Decorator.
An antipattern is a recurring solution or practice that appears useful but commonly produces negative consequences because of its structure, context, or implementation. Examples include God Object, Spaghetti Code, Copy-and-Paste Programming, and using exceptions for normal control flow.
Maintainability is the degree to which software can be understood, corrected, adapted, tested, and extended effectively.
Coupling describes the degree of dependency between software components. High coupling can make components harder to change and test independently.
Cohesion describes how closely the responsibilities within a module or class are related. High cohesion generally indicates that a component has a clear and focused purpose.
Data-flow analysis examines how values are defined, propagated, used, and modified along possible execution paths. It can reveal uninitialized variables, unused assignments, null-value propagation, and improperly handled input.
Control-flow analysis examines the possible order in which program statements or basic blocks can be executed. It supports the detection of unreachable code, infinite loops, missing return paths, and infeasible branches.
Taint analysis tracks data from potentially untrusted sources to security-sensitive operations. For example, it can detect whether unchecked user input reaches an SQL query, operating-system command, or HTML output.
In security-oriented data-flow analysis:
- a source introduces potentially untrusted or sensitive data;
- a sink is an operation where such data may cause harm or disclosure.
Static Application Security Testing (SAST) analyses source code, bytecode, or binaries without executing the application to identify potential security vulnerabilities.
A suppression instructs an analysis tool not to report a particular finding or rule violation. Suppressions should be documented and narrowly scoped because they can hide real defects.
A quality gate is a set of conditions that software must satisfy before it can proceed to another development stage. Typical conditions concern new vulnerabilities, severe defects, duplicated code, maintainability ratings, and test coverage.
Load the example project
- Extract the workspace.zip file.
- Start IntelliJ IDEA.
- Select
File -> New -> Project from Existing Sources...and choose the extracted project directory. If the project contains a Maven or Gradle build file, import that file as the project descriptor.
Opening the project in Eclipse
The provided file contains an Eclipse project. To open it in the original environment:
- Start Eclipse
File -> Import ... -> General -> Existing project into workspace
Projects in IntelliJ
IntelliJ is capable of opening and managing various project types. Eclipse projects are usually provided as .project or .classpath files. For Maven projects, the pom.xml file acts as the project descriptor. For Gradle projects, this is the *.gradle file.
Code Review
Code review is the systematic examination of source code, usually by one or more people other than the author. In many workflows, proposed changes are reviewed before they are merged into the shared codebase. Reviewers look for functional defects, security and maintainability problems, unclear logic, inadequate tests, and deviations from project conventions, and they record actionable findings.
Responsibility for code review depends on the organization and the development process. Developers usually review implementation code, while testers often contribute expertise concerning testability, boundary conditions, error handling, automation logic, and test coverage. Test code also requires review for correctness, maintainability, reliability, and independence from the implementation.
In modern development workflows, static analysis tools are commonly integrated into the CI pipeline. These tools act as a form of quality gate, automatically checking for style violations, security issues, code smells, and other problems before code can be merged. This helps ensure that basic quality standards are enforced without relying solely on manual reviews.
There are a few basic rules to follow during a code review:
- Clarify and define the goals of the review!
- Understand the code!
- Build and test the code before the review!
- Keep each review session focused and reasonably short!
- Prefer small changes; large changes should be divided into reviewable units where possible!
- Provide constructive criticism and avoid personal remarks!
- Use checklists!
The most important aspects to consider during a code review are: structure, style, logic, performance, readability, and functionality.
Questions we may ask:
- Do I understand what the code does?
- Does the code work the way it should — meaning according to the functional specification?
- Does the code comply with the company’s coding style?
Static Analysis
Static code analysis examines source code, bytecode, or binaries without executing the program under analysis. Depending on the tool, it can identify potential defects, vulnerabilities, rule violations, duplicated code, and maintainability problems. Analysis may run in an editor, during compilation, as a separate build step, or in a CI pipeline; it is not limited to compile time.
Preparations
Install the following analyzers in IntelliJ
-
- Open: JetBrains Marketplace SpotBugs and click GET.
- Select your IntelliJ version (community, ultimate).
- Choose a plugin version and click the download link.
- In IntelliJ, open the settings menu (CTRL-ALT-S).
- Click the Plugins menu.
- Click the gear icon and select
Install plugin from disk. - Locate the downloaded plugin (e.g.,:
spotbugs-idea-1.2.5.zip) and install it. - Restart IntelliJ.
SpotBugs installation:
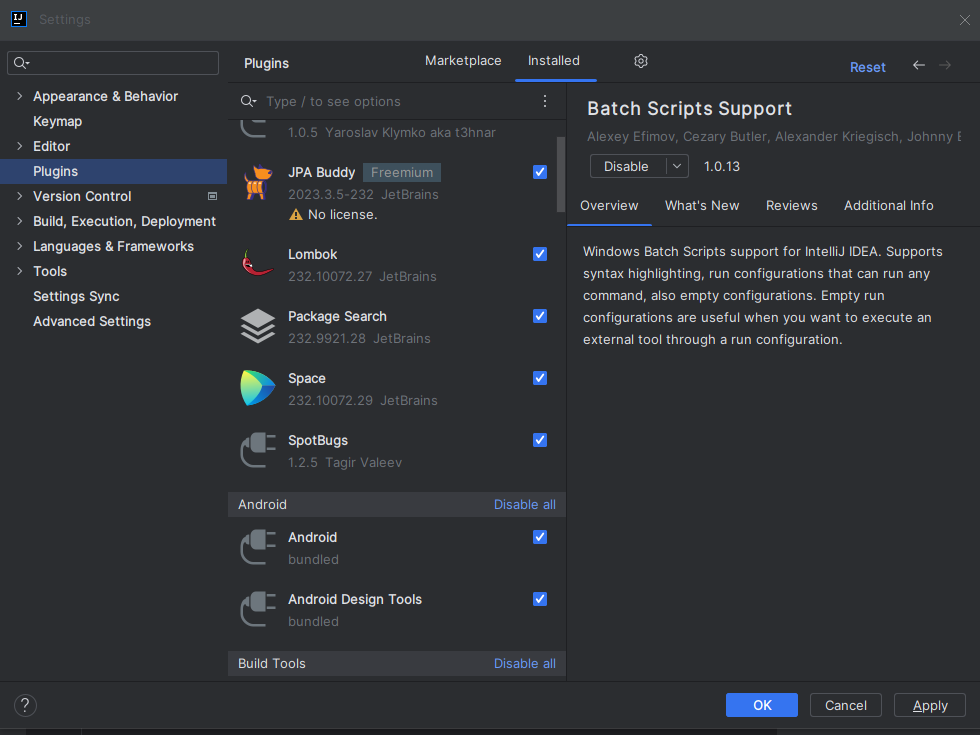
-
PMD installation:
- Link: PMD plugin
- Open the link and click GET.
- Select the IntelliJ version (community, ultimate).
- Choose a plugin version and click the download link.
- Navigate to Plugins.
- Using the gear icon, choose
Install plugin from disk. - Install the downloaded plugin (e.g.,:
PMDPlugin-1.8.26.zip). - Restart IntelliJ.
-
Checkstyle installation:
- Link: Checkstyle IntelliJ Plugin
- Open the link and click GET.
- Select the IntelliJ version (community, ultimate).
- Choose a plugin version and download it.
- Open IntelliJ settings (CTRL-ALT-S).
- Go to Plugins.
- Use the gear icon to select
Install plugin from disk. - Install the downloaded Checkstyle plugin archive.
- Restart IntelliJ.
Installing static analyzers in Eclipse
In Eclipse, installation works as follows:
- SpotBugs
Help -> Eclipse Marketplace- Search: spotbugs; install
SpotBugs Eclipse plugin 3.1.5 - PMD
Help -> Eclipse Marketplace- Search for PMD and install the PMD Eclipse plugin.
- Checkstyle
Help -> Eclipse Marketplace- Search for Checkstyle and install the Checkstyle plugin.
Differences from the installation steps
There may be differences between Eclipse and IntelliJ versions compared to the process described above!
Pre-commit hook
Tools like Checkstyle can support consistent code quality by automatically enforcing the project’s coding standards. Checkstyle can also be integrated into a Git pre-commit hook, preventing developers from committing code that violates the defined style rules. This ensures that many formatting and structural issues are caught early—before the code reaches the review or CI stages.
Using the Static Analyzers
All analyzers can be launched from the project context menu
Right-click the project and select one of the following options, depending on the analyser you want to run.
- SpotBugs -> SpotBugs
- Checkstyle -> Check Current File
- PMD -> PMD
Results normally appear in the editor or in a dedicated tool window. The exact menu name and location depend on the IDE and plugin version.
Static analyzer reports may be huge!
Pay attention to how the tools are configured. These tools can report a very large number of issues, which may become counterproductive. (A developer may gladly examine 10 issues, but if we present 10,000 at once, they will not even start.) Configure the system to show only the most important issues!!
Which issues are considered important?
The answer depends on the system, organization, and context. Warnings pointing to concrete bugs, vulnerabilities, or potential failures are usually more important than cosmetic issues. However, persistent readability and consistency problems can also increase long-term maintenance costs. Static-analysis settings can be accessed in IntelliJ IDEA as described below.
Settings
Checkstyle
* File -> Settings
1 2 3 4 5 6 | |
SpotBugs
* File -> Settings
1 | |
PMD
* File -> Settings
1 2 3 4 | |
- SpotBugs
- Projekt context menu ->
Properties -> SpotBugs Configure Workspace Settings
- Projekt context menu ->
- Checkstyle
Window -> Preferences -> CheckstyleNew or Copy -> Configure...- PMD
- Window menu ->
Preferences -> PMD -> Rule Configuration
Tools for other languages
C/C++ Cppcheck
Cppcheck is one of the most widely used static code analyzers for C and C++. Its main advantage is that it is not a compiler, meaning it can detect issues that compilers often miss.
What does it analyze?
- memory leaks
- dereferencing null pointers
- out-of-bounds access
- resource-management issues
- uninitialized variables
- unnecessary or incorrect logic
- dangerous implicit conversions
- C++-specific issues (RAII misuse, STL misuse, etc.)
Advantages:
- focuses on relevant findings and can be configured to control false positives
- easy to integrate into CI pipelines
- available both as CLI and GUI
- supports MISRA rulesets
MISRA
MISRA provides best practice guidelines for the safe and secure application of both embedded control systems and standalone software.
Execution:
1 | |
C/C++ Valgrind - not a static analysis tool!
Valgrind is a powerful dynamic analysis framework widely used in C and C++ development to detect memory-related errors and performance issues. While Cppcheck performs static analysis, Valgrind analyzes the program while it runs, making it indispensable for uncovering runtime memory problems. Although not a “static analyzer” in the strict sense, it is one of the most important tools for memory correctness — and often taught alongside static analysis.
What does Valgrind do?
Valgrind provides several analysis tools, the most important being Memcheck, which detects:
-
Memory errors
-
Invalid reads and writes (accessing memory you don’t own)
- Use of uninitialized memory
- Reading/writing freed memory
- Overrunning buffers
-
Stack and global memory misuse
-
Memory leaks
-
Definitely lost memory (true leaks)
- Indirectly lost memory
- Possibly lost memory
-
Reachable but never freed memory
-
Incorrect heap usage
-
Double free
- Mismatched malloc/free or new/delete
- Incorrect realloc usage
Python - Pylint
Pylint is one of the most comprehensive and strict static analyzers and linters in the Python ecosystem.
What does it analyze?
- typical errors: missing attributes, wrong module references, typos
- variable and function type issues
- unused variables and unused imports
- code complexity (cyclomatic complexity)
- PEP8 style guide violations
- import order issues
- missing documentation and naming convention problems
Advantages:
- detailed, structured reports
- gives each module a score (0–10)
- highly configurable
- extensible with custom rules
Example execution:
1 | |
JavaScript / TypeScript — ESLint
ESLint is the standard static analyzer and linter for JavaScript and TypeScript.
What does it analyze?
- JavaScript syntax errors
- unused variables and unused imports
- dangerous comparisons (== instead of ===)
- async/await misuse
- promise handling issues
- TypeScript type errors (when used with TSESLint + TypeScript compiler)
- code style and best practices
Advantages:
- extremely extensible (hundreds of plugins)
- strong TypeScript support (
@typescript-eslint/*) - widely used rule presets (Airbnb, Google, etc.)
- automatic fixing with --fix
Example execution:
1 | |
SonarQube
SonarQube is a widely used, enterprise-grade static analysis and code quality platform that supports more than 25 programming languages, including:
- Java, Kotlin
- Python
- C/C++
- JavaScript / TypeScript
- Go, PHP, C#, Ruby, Scala
- …and many others.
It is typically deployed as a server application that continuously analyzes source code from Git repositories or CI pipelines, providing dashboards, reports, and quality metrics.
What does SonarQube analyze?
SonarQube focuses on three core areas:
-
Bugs
- null pointer dereferences
- logic errors
- incorrect conditions
- boundary errors
-
Vulnerabilities
- SQL injection
- XSS
- insecure deserialization
- use of deprecated or unsafe APIs
-
Code Smells
- duplicated code
- overly complex methods
- long parameter lists
- poor naming conventions
- unused code
A core SonarQube feature is the Quality Gate, which is a set of conditions that must be met before code can be merged.
Metrics and Dashboards:
SonarQube gives visual dashboards:
- Maintainability rating (A–E)
- Security rating
- Reliability rating
- Code duplication percentage
- Cyclomatic complexity
- Coverage imported from external test-coverage tools
- Technical debt estimation (minutes/hours)
This makes it a preferred tool in organizations that enforce code quality standards.
How does SonarQube work?
-
SonarQube Server
-
Runs the UI, dashboards, database, rule sets.
-
Sonar Scanner
-
Runs the analysis (via CI or locally):
1
2
3
```bash sonar-scanner ``` -
Plugins and Rules
SonarQube supports:
-
built-in rules for each language
- community plugins
- extension mechanisms and custom rules, depending on the language and edition
OpenStaticAnalyser (OSA)
OpenStaticAnalyzer is an open-source, multi-language static code analysis platform created to detect coding issues, security vulnerabilities, and maintainability problems across various programming languages.
OpenStaticAnalyzer performs static analysis of source code and aggregates findings and metrics that can support targeted short- and long-term quality improvement.
Product characteristics:
- Platform-independent command line tools
- Transparent integration into build processes
- Powerful filter management
- Coding issue detection:
- Metric threshold violations (MetricHunter module)
- Common programming mistakes (clang-tidy)
Cppcheck 2.5coding rule violation- Re-prioritized and carefully selected
PMD 6.32.0coding rule violations SpotBugs 4.2.2coding rule violationsPylint 1.9.4and2.3.1coding rule violationsFxCopcoding rule violationsRoslyn Analyzercoding rule violationsESLintcoding rule violationsSONARQUBE™ platform 8.0coding rule violations
- Clone detection (copy-pasted source code fragments) extended with clone tracking and "clone smells"
- Syntax-based, so-called Type-2 clones
- Metrics calculation at component, file, package, class, method, and function levels:
- Source code metrics
- Clone metrics
- Coding rule violation metrics Supported languages: Java, Python, C#, JavaScript, C/C++.
OSA has a commercial version called SourceMeter.
.NET tools
- FxCop is a free static code analysis tool from Microsoft that checks .NET managed code assemblies for conformance to Microsoft's .NET Framework Design Guidelines.
- Roslyn Analyzers are tools built on the .NET Compiler Platform (Roslyn) that analyze C# or Visual Basic code to ensure style, quality, maintainability, and adherence to design principles. These analyzers operate during design time, providing real-time feedback in the code editor and error list.
LLM Support for Static Analysis and Code Review
A large language model (LLM) can assist static analysis and code review by explaining unfamiliar code, identifying candidate defects and security risks, comparing an implementation with requirements or coding rules, and prioritizing findings produced by conventional analysis tools. It can also suggest refactorings, generate or improve code documentation, and create candidate unit tests and test cases for normal, boundary, and error conditions.
An LLM does not replace a compiler, a static analyzer, a test runner, or a human reviewer. Its findings are hypotheses: it may overlook defects, report false positives, misunderstand project-specific behaviour, or generate incorrect expected test results. Proposed changes and tests must therefore be reviewed and executed.
Using LLM for static analysis
Consider the following Java method:
1 2 3 4 5 6 7 | |
An LLM-assisted review may:
- identify possible
NullPointerExceptionerrors when the list or an element isnull; - identify division by zero when the list is empty;
- warn that
intaddition can overflow and that integer division discards the fractional part; - ask whether these behaviours agree with the specification;
- propose Javadoc describing the input, result, rounding rule, and exceptional cases;
- generate unit tests for a normal list, an empty list, a
nulllist, negative values, fractional averages, and values near the integer limits.
A suitable prompt is:
1 2 3 4 5 6 7 8 9 10 11 12 | |
The reviewer must verify each claim against the requirements and run the generated tests. Documentation should describe approved behaviour rather than merely preserve assumptions made by the model.
Exercises
Examining the Calculator
Examine the code in the Calculator package inside the workspace.zip!
Run the static analyzers—at least SpotBugs—on the project. Examine the report and select examples of both severe and minor findings.
- What issues were found by the analyzers?
- Are all issues found by the tools real issues?
- (Note: not all issues reported by static analysis tools are actual problems; local project settings and frameworks may influence the results.)
- What happens if you reduce the minimum rank in SpotBugs from 20 to 15?